How to sell your innovations, even in a climate of financial cautiousness

The CROP version of Everett Rogers’ innovation adoption model. 
koala-en-feu-gettyimages-1201131357_uid61a8d6349aded

In 1962, American sociologist and statistician Everett Rogers published his landmark title, Diffusion of Innovations, which explained how new ideas and innovations spread through the population over time. (This book was already in its 5th edition in 2003).

The purpose of this article is to quantify and profile the different types of adopters (or non-adopters) in today’s Canadian marketplace.

For those unfamiliar with Rogers’ model, it looks like this:

diapositive6_uid61c25b67421b1

According to Rogers, when an innovation is first introduced to the marketplace, only a small group of individuals who are especially open and enthusiastic about new ideas and change will adopt it (take the cellphone. for example).

These individuals will also tend to have above-average incomes, since many innovations will be quite expensive when first introduced, although the price will drop with their diffusion.

Rogers divided these individuals into two groups and dubbed them the Innovators and Early Adopters (his term).

As an innovation continues its spread, it encounters more or less open or resistant segments, until it is adopted by virtually the entire population (hence the 100% at the top of the vertical axis on the right of the graph).

The theory underlying this segmentation was based on a modeling of consumer adoption behaviours, which postulated a distribution based on a normal curve.

This academic and sociological theory is meant to describe the stages of innovation diffusion and adoption by the population.


CROP’s approach

While we classify consumers in today’s markets based on a model analogous to Rogers’, our goal is directed more to understanding the needs, values and hot buttons of the different types of adopters in order to support the marketing efforts used to promote an innovation.

Consequently, we have been tracking certain indicators for several years. These provide a very clear picture of consumer attitudes to innovation, as well as the evolution of these attitudes.

Here are two examples among the various indicators that we follow annually:

diapositive6_uid61c25b67421b1
diapositive9_uid6324b85fd37a1

Our diffusion and adoption curve

From all the indicators we track for the adoption of innovation, we have managed to reproduce the Rogers model by adapting it to today's markets, which gives us the curve below. (We have grouped Innovators and Early Adopters into a single category, since their profiles are identical for all practical purposes):

diapositive10_uid6324b953cdb0f

In addition, our databases have let us to track the evolution of this classification of consumers over the years, which produces the following table:
 

diapositive7_uid61c4dc078bb8d

The trend

As can be seen from the two indicators presented above, along with the overall distribution of our adoption curve, enthusiasm for innovation rose strongly from 2010 to 2018.

This rise has followed and even fuelled our Consumer Enthusiasm Index, which also peaked in 2018.

diapositive12_uid6324bb9deecc8

The year 2019 marked a pause in the upward rise of all these indicators, as if consumers, after years of frenzied buying, were experiencing a sudden bout of cautiousness.

The pandemic in 2020 accelerated this trend of prudence. We saw consumption enthusiasm recover in 2021, then stabilize in 2022 in a climate of rising inflation and interest rates.


The CROP innovation adoption curve

While Rogers’ model assumes that innovations spread in a linear fashion over time by filling the “quotas” from one adopter segment to another (moving gradually from Early Adopters to Laggards), our approach assumes instead that consumers in each of these segments can be “converted” at any time if we know how to push the the right hot buttons (even if the linearity of the Rogers model is still valid today).

For example, if a rather traditional brand hopes to reach new customers by introducing an appropriate innovation to the market (of probable interest to Early Adopters), it will take very specific arguments to convince the rather traditional niche it already serves.

That’s why our approach is to examine the specific values profile specific to each type of adopter.


From Early Adopters to Laggards

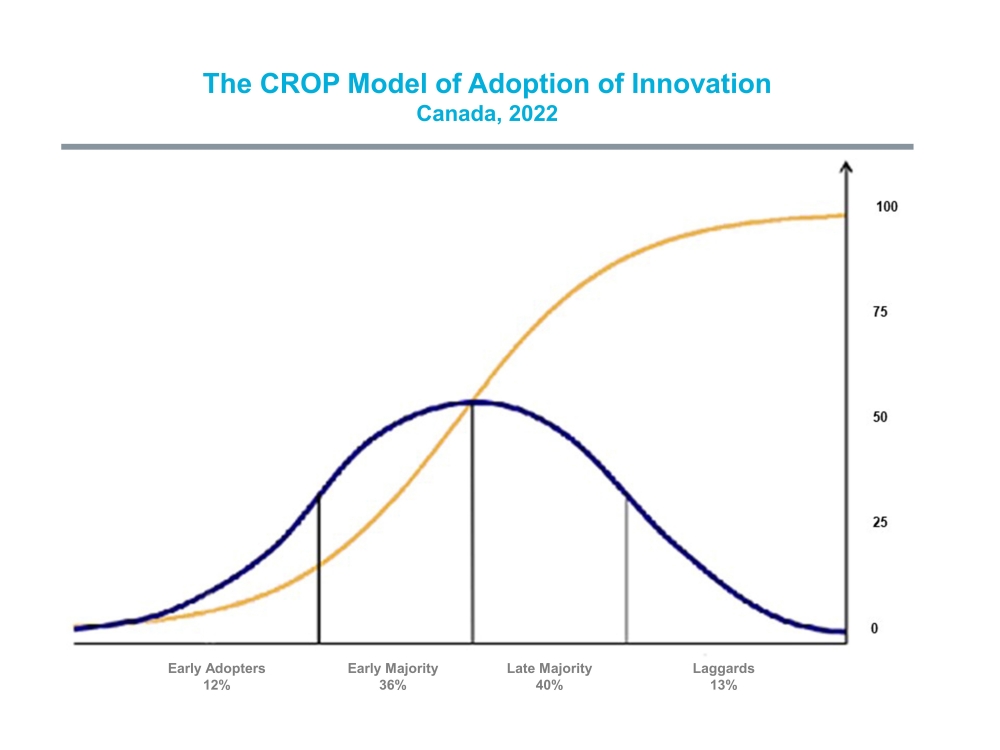
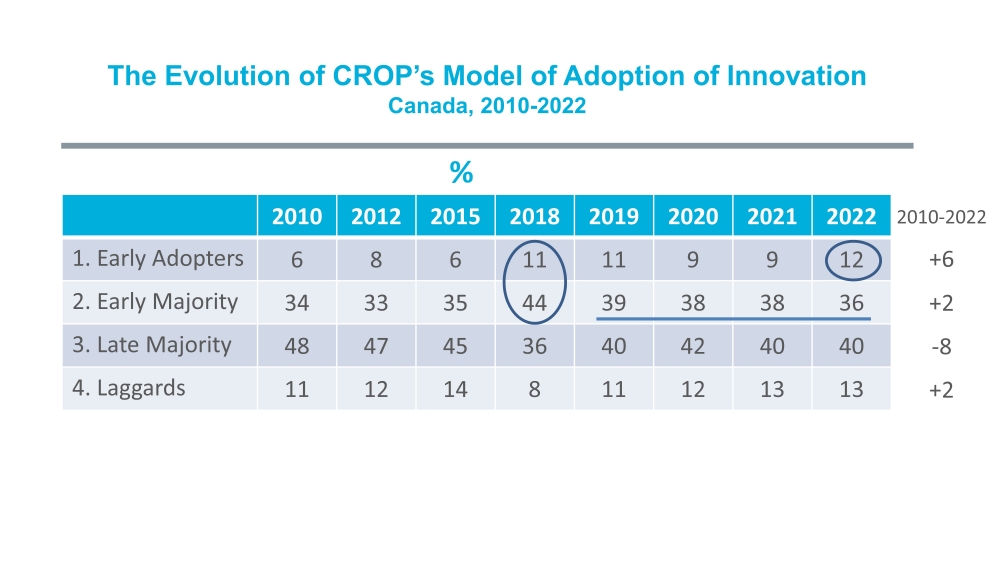
Early Adopters (12%)

See This is not an innovation, a capsule on our website devoted to this specific segment.

Early Adopters are basically explorers! They want to discover life, the world, themselves, and are keen to seek out opportunities. They strive to continuously transform their lives in order to develop and express their potential and creativity.

The main hot buttons for mobilizing them are:

personal development and creativity

pleasure, hedonism, thrills

connection with others, diversity and nature

pride, experience status to display with innovation


Early Majority (36%)

The Early Majority expect an innovation to be somewhat proven. They need to see how Early Adopters behave with it.

However, it is possible to accelerate their adoption of an innovation by creating a status experience around it.

The Early Majority are highly motivated by social standing. Being able to show off an innovation fully meets this need.

They also share some traits with the Early Adopters, but in a less pronounced way, including:

personal development and creativity

pleasure, hedonism, thrills

connection with others, diversity and nature


Late Majority (40%)

The Late Majority are the most difficult to convince. As Rogers says, time will do its job to eventually spread the innovation to them.

Even if their attitude to innovation is not as resistant as the Laggards’, they have very few hot buttons that can be exploited to entice them (unlike with the Laggards, as we shall see).

The Late Majority’s resistance to innovation comes from their great prudence and frugality when it comes to consumption – a profile somewhat akin to voluntary simplicity.

Innovation represents the kind of consumption they are trying to reduce. It also represents change, a source of uncertainty for them.

However, because they need a certain amount of control over their lives and experiences, if an innovation can be positioned as a way of doing this, it could capture their attention.


Laggards (13%)

Laggards represent the quintessence of voluntary simplicity – the No Logo, par excellence. (They also typify the portrait of our No Logo, one of our segments in our segmentation of the values of consumers and citizens). Laggards systemically oppose innovation, which they associate with the gadgets being thrust on everyone by the consumer society. They oppose this as a blatant waste of resources.

But Laggards are very keen to protect the environment by embracing the most sustainable possible lifestyle and doing whatever they can to save the planet.

Unlike Rogers’ Laggards, our Laggards are not anti-change. They are anti-consumption due to their ecological convictions.

However, these same convictions can be used as an argument to convert them to buy an innovation if you can show that the innovation can reduce their carbon footprint or protect the environment?

An ecological positioning could convince the most resistant to adopt certain innovations!


The opportunity

The opportunity is about stimulating markets. For brands, companies and even some institutions (financial, especially), innovation has become unavoidable.

Consumption is fuelled by innovation. Brands and companies have no choice but to innovate.

Far be it from us to promote unreasonable or irresponsible consumption, but appropriate innovations can add value to society – and we need to find the optimal ways to promote them.